Business Intelligence and Data Analytics
GrantSolutions’ Business Intelligence (BI) and Data Analytics services transform complex grant data into clear, actionable insights. Agencies use interactive dashboards to track performance, visualize outcomes, and demonstrate impact with transparency and confidence.
Key Features: Tools that Work for America
GrantSolutions provides agencies with powerful analytics and visualization tools to transform raw data into measurable results.
- 100+ standard dashboards covering the full grants lifecycle
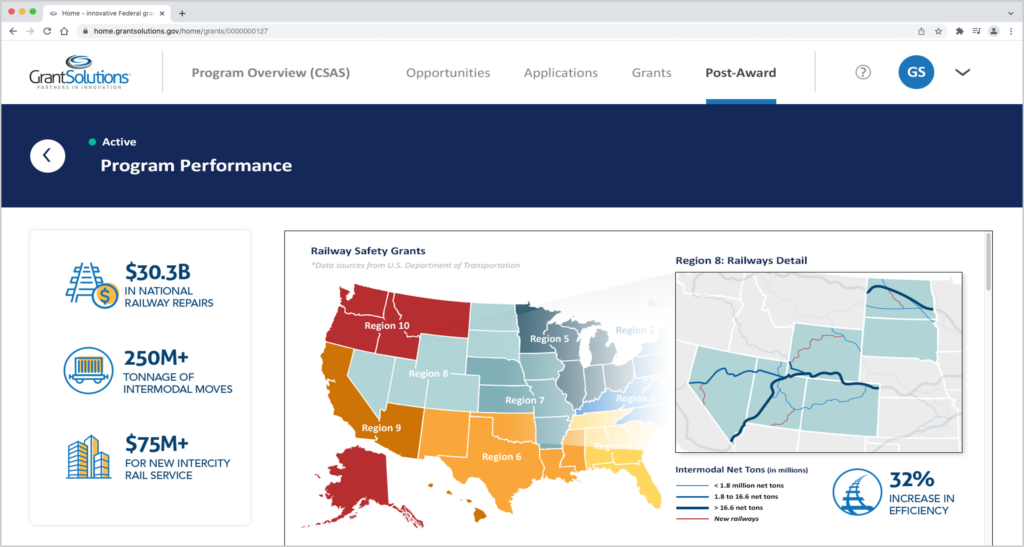
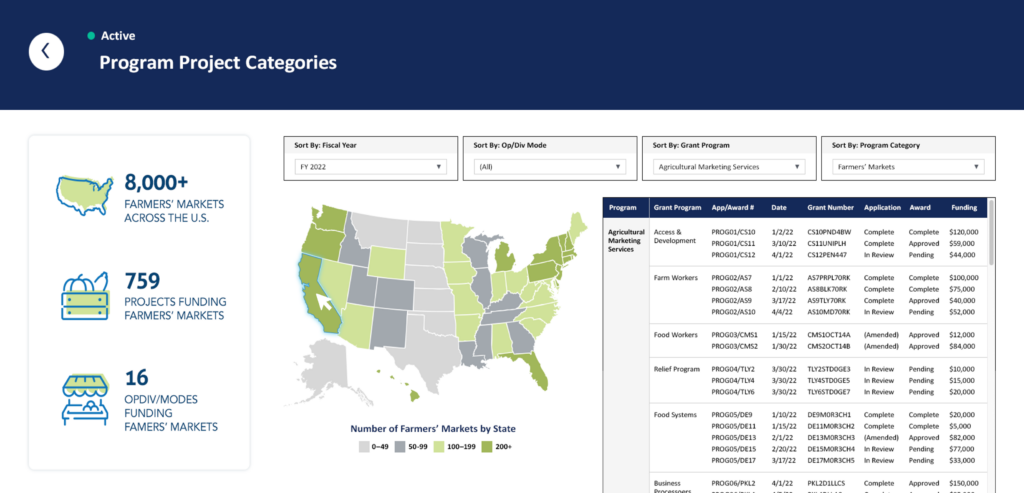
- Interactive maps and charts for clear, shareable visualizations
- Executive-level views with drill-down capabilities for detailed analysis
- Program and recipient scorecards that convert data inputs into measurable outcomes
- External system integrations to reduce burden and expand analysis
- Rapid development of custom dashboards and reports tailored to agency needs
Benefits

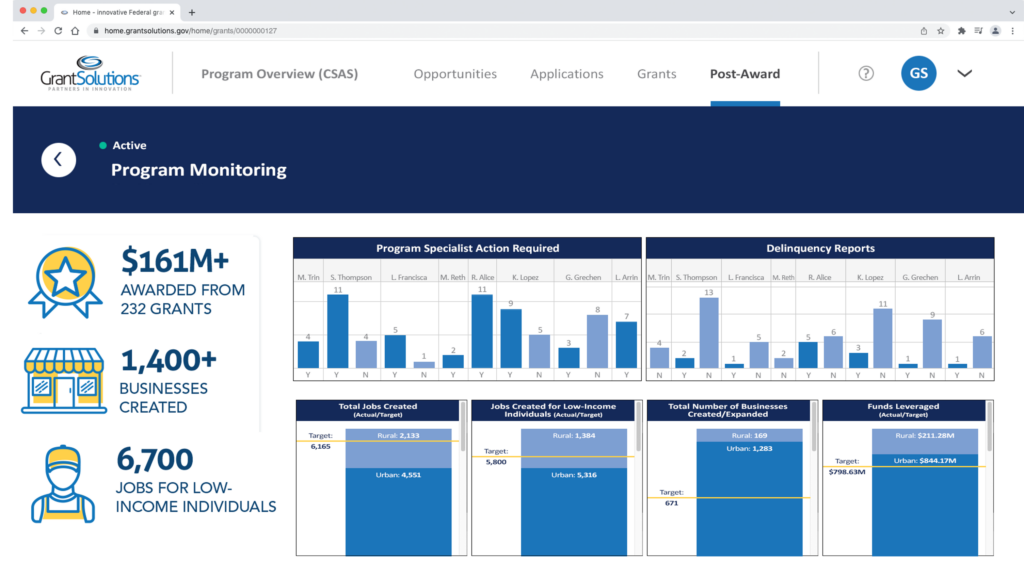
Executive dashboards provide leaders with a clear view of performance at every level.

Key performance indicators and scorecards highlight progress and outcomes for programs and recipients.

Custom reports offer rapid, flexible insights tailored to agency priorities.

Integration of external datasets adds context such as demographics and risk factors to support decision-making.

Clear ROI tracking demonstrates the measurable impact of grant investments and strengthens public accountability.
Turning Data into Impact
Federal Partners using BI dashboards have moved beyond basic reporting to true performance insight. With hourly data refreshes and interactive visualizations, agencies can monitor progress in real time, strengthen oversight, and clearly show the value of taxpayer investments. These tools help leaders base decisions on evidence and focus resources where they matter most.
View More Services
Explore related services:

Risk Management
Uses Recipient Data Insights (RDI) to analyze recipient risk, reduce fraud, waste, and abuse, and improve compliance.

Administration
Support services that provide surge capacity and help manage the day-to-day operations of grant programs.

Discretionary/Non-Discretionary Management
Full Federal grant lifecycle support for grantors and recipients from planning to closeout.
Want to find other services? Return to the services overview and continue browsing:
Partnering with GrantSolutions delivers better outcomes
Explore the process, requirements, and benefits of Partnering with GrantSolutions to streamline operations, reduce waste and fraud, and ensure taxpayer dollars achieve their highest impact.
